Interactive Lab Workshop
Ecosystem Telemetry & Monitoring Frameworks
Practical training in building robust observability stacks for blockchain nodes using Prometheus, Grafana, custom RPC health probes, and log parsing.
Duration
4 Hours
Delivery Mode
George Town Lab or Remote
Target Audience
Site Reliability Engineers, Node Operators, Infrastructure Leads
Pricing Guidance
RM 950 per participant
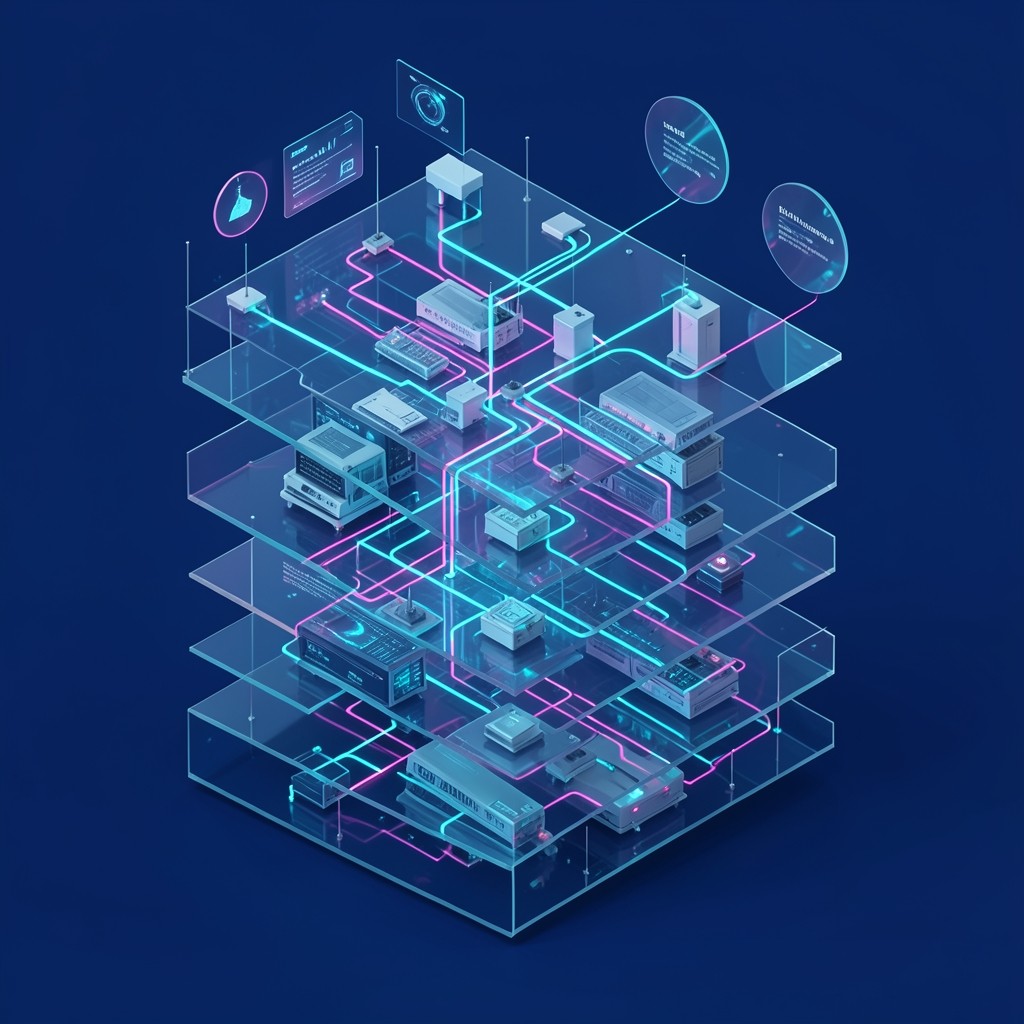
Reliable validator and node operations demand continuous visibility into hardware performance, peer connections, memory utilization, and block synchronization speed. The Ecosystem Telemetry & Monitoring Frameworks workshop equips engineers with the tools and configurations necessary to maintain optimal node uptime and rapid incident response.
Core Workshop Topics
1. Telemetry Architecture & Metric Exporting
- Instrumenting node daemon binaries with Prometheus exporter endpoints
- Key metrics to monitor: slot lag, skipped blocks, vote attestation latency, and peer count
- Profiling memory consumption and Garbage Collection (GC) pauses under high transaction load
2. Dashboarding & Real-Time Visualization
- Building actionable Grafana dashboards tailored for operations teams
- Correlating hardware performance (NVMe write amplification, CPU thermal throttling) with network throughput
- Tracking validator peer propagation times across geographic regions
3. Automated Alerting & Incident Response
- Configuring Alertmanager rules with severity hierarchies
- Setting up webhook integrations with Discord, Slack, and on-call paging services
- Creating automated self-healing scripts for non-critical node restarts
Lab Artifacts Provided
Participants leave the session with:
- Pre-built, production-tested Grafana JSON dashboard templates
- Alertmanager configuration rulesets for critical node failure modes
- Diagnostic bash scripts for instant peer health and disk IOPS benchmarking
Contact our team to arrange a session for your engineering group.
Register for an Upcoming Cohort or Inquire for Your Team
We organize small cohorts to preserve high teacher-to-student interactivity and dedicated hands-on sandbox guidance.